
BRIEF: Matica Enterprises – Simply Put, We Were Wrong
Sometimes, you have to concede defeat to a worthy contender. Today, that is what we are doing. Simply, we were wrong about Matica Enterprises (CSE: MMJ). We originally wrote about Matica Enterprises back on November 4, where we alerted investors that private placement shares would become free trading shortly. We then went on to estimate that the stock price may suffer as a result of these shares becoming available for trading purposes. The original post in all of its erroneous glory can be found here.
Now, lets rephrase that a bit. Specifically, we were wrong about the value of each share potentially dropping. Instead of this occurring, the company has been on a rally since the day the shares became available for trading. This does not mean that the other issues we identified are simply wiped away, leaving the company with a clean slate. Those issues did in fact arise – however, companies can grow up from their junior mistakes. That just might be whats happening here. Time will tell.
In the mean time, here’s some technical analysis for those currently invested in the stock. Consider it our gift to you for our incorrect estimate.
Matica Enterprises’ Daily Chart
First and foremost, we’ll take a look at the daily chart. This is the chart that you typically want to look at first when performing technical analysis on a stock. It gives you a quick picture of where the stock has been as of late, and where it may go.
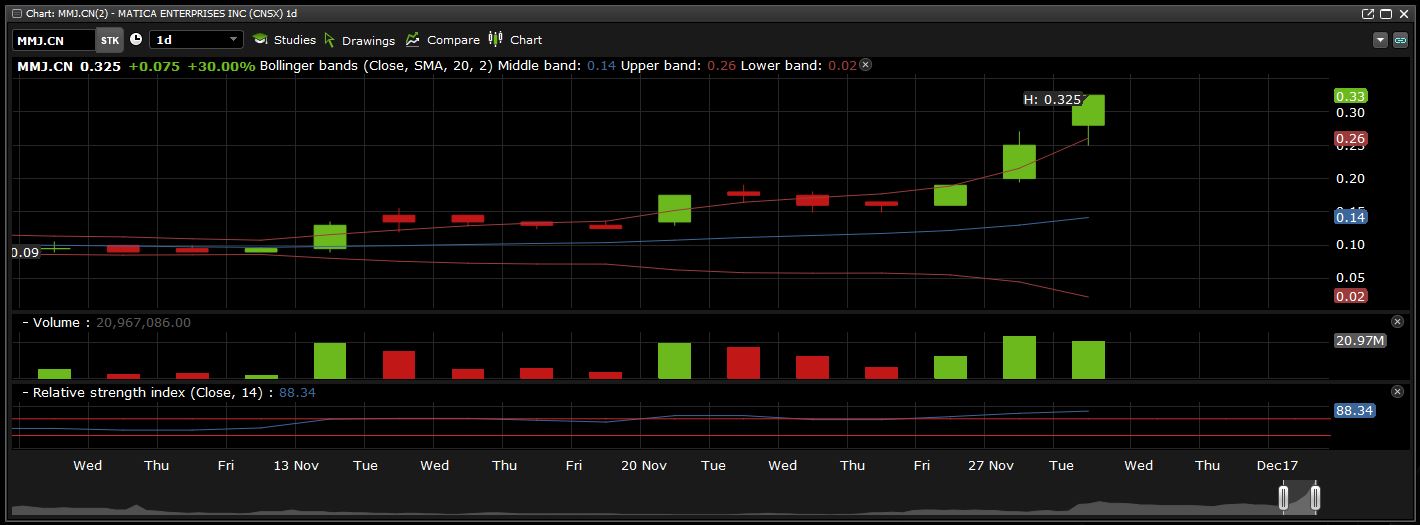
The Basic Indicators for the Daily
To begin, lets look at the chart with some basic indicators that have been overlayed. Primarily, we utilize three indicators – bollinger bands, volume, and the relative strength index. When it comes to bollinger bands, you want the stock to be between the upper and lower band. The price of the equity will natural correct itself if it is not confined within these limits.
This natural phenomenom can be evidenced over the last two trading weeks for Matica Enterprises. On both the 13th of November, and the 20th, MMJ shot above the upper band. It then spent the next several days return to normalcy. As it stands, the upper band sits at $0.26, while the stock closed at $0.325. This in turn indicates a major gap exists between where the stock presently is, and where it will naturally return to. Although in the next trading session the value of the upper band will change, remain aware of this. The stock will naturally return to below this line.
Further evidence of this potential pullback is based on the declining volume. With the bullish volume declining over the previous days volume, it signals bulls are growing tired. Once bulls are tired, its time for the bears to take over, even if it is only momentarily. The relative strength index adds additional weight to this argument, as it currently has a value of 88.34 on the daily, signalling overbought conditions. A range between 30 and 70 is ideal for this indicator.
This is not to say that Matica Enterprises WILL pullback tomorrow, it simply indicates that the stock is currently experiencing overbought conditions, and that it is likely to retreat back to behind the upper bollinger band. This band will be at a higher level tomorrow.
The Marked Up Chart
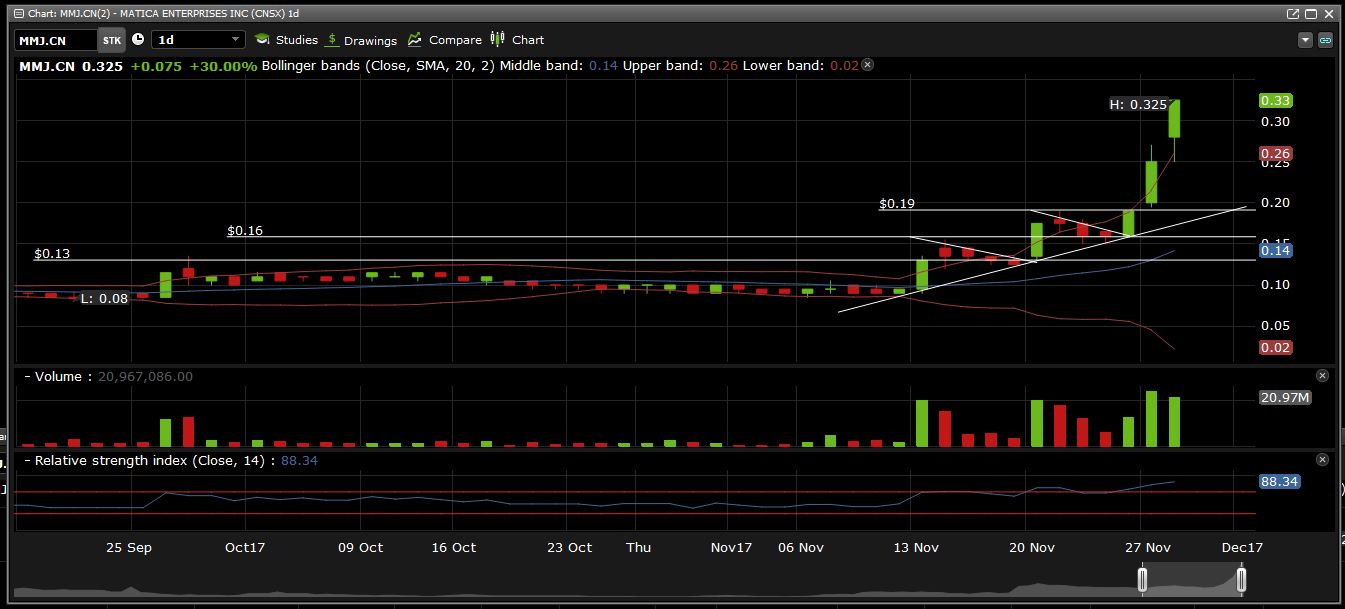
Now that we’ve addressed the basic indicators, lets look at some slightly more in depth technical analysis. As we previously mentioned, the stock initially broke out in to a new pattern on November 13. It experienced a load of bullish volume on this date. Over the next four days it was time for the bears to step in. This in turn created a bull flag for Matica Enterprises. The process was then repeated the following week, providing substantial gains for investors.
After this second bull flag, the stock put it in to high gear. It broke the upward trend line that it was following for a period of two weeks, and went vertical. This culminated in the stock spending a solid three days and counting over the upper bollinger band, which has also sent the relative strength index into overdrive.
One positive aspect about these bull flags forming before the stock went vertical, is the support lines that it now provides for the equity. Currently, expect support to come in at $0.13, $0.16, and $0.19. Be aware that it may be the half penny above or below that sees the highest area of support should the stock fall back to these levels. The down fall of the stock going straight north is that it gives little time for the equity to form a new base of support. There should be some minimal support at the $0.25 area as well.
Matica Enterprises’ Weekly Chart
The weekly chart is the second chart that you should typically pull up as an investor. It gives a broader picture of how the stock performs on a wider basis. This in turn gives you a sense of the stability the stock has at a particular price level.
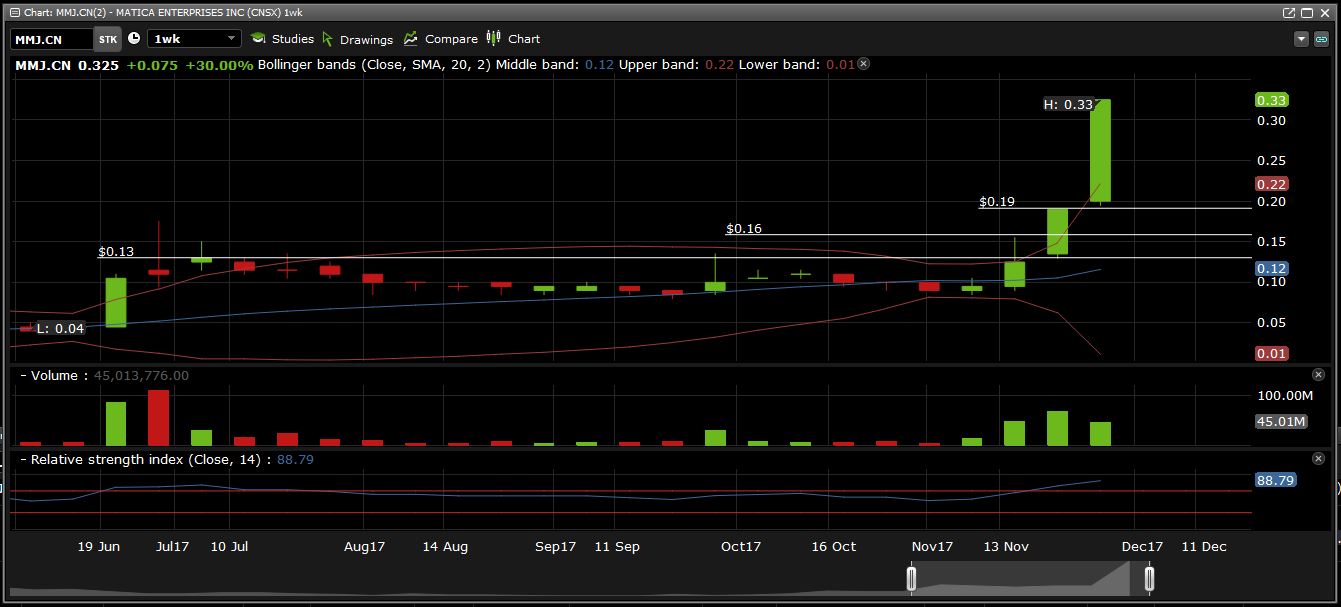
In terms of the weekly chart, Matica Enterprises looks quite similar. First and foremost, note our support lines that have been reaffirmed by the weekly chart. This will give them further strength when it comes time for them to be tested. The $0.13 and $0.19 support levels will provide bears with the most trouble.
With respect to the bollinger bands, Matica Enterprises is highly extended from the upper band which is located at $0.22. This may signal that the stock will give up some of its gains before the weeks end as it attempts to naturalize itself. However, with this being only the second candle above this band, it may be able to fend it off for another week or two before returning to lower levels. Although with the relative strength index currently resting at 88.79, it indicates that the stock is becoming severely overbought on this time frame.
Lastly, the volume is presently at a decrease from the volume experienced for the previous candle. However, this will likely change as we are only 2/5 of the way through the candles time frame. It is highly unlikely that we see a decrease in volume over the previous candle by the time it closes.
Closing Statements
First and foremost, we were wrong. Above all, this is excellent for long term investors of Matica Enterprises. We’re well aware that there is several of you that have been in it for the long haul, and we tip our hat to you for sticking through some blunders. Doing so is not easy.
With respect to the technicals of Matica Enterprises, the best thing that could happen for investors is nothing at all. We all love to see massive gains in our portfolio, there’s no doubt about it. However, what Matica needs at this point is for the stock to form a base. This will need to occur over several days – maybe even a week or two. This would then enable the equity to prepare for its next leg up after forming a firm level of support that investors can rely on. Without these firm support levels, the stock is likely to give up some of the gains just as quickly as it received them.
Read the financials. Read the charts. Dive deep.
Information for this analysis was found via The CSE, The Deep Dive, and Questrade. The author has no securities or affiliations related to this organization. Not a recommendation to buy or sell. Always do additional research and consult a professional before purchasing a security.
As an aside, we recently became an affiliate of Questrade. If you’re currently looking for a new low cost broker, with an excellent charting program, look no further. If you sign up through this link, they’ll also provide you with $50 worth of free trades, and I’ll make a couple bucks on the deal to help support further deep dives.

As the founder of The Deep Dive, Jay is focused on all aspects of the firm. This includes operations, as well as acting as the primary writer for The Deep Dive’s stock analysis. In addition to The Deep Dive, Jay performs freelance writing for a number of firms and has been published on Stockhouse.com and CannaInvestor Magazine among others.