
The Fraser Institute has released its annual Canadian Consumer Tax Index, a defacto “pain-o-meter” to gauge how much, exactly, the average Canadian consumer has gotten bent over by their government over the past 61 years.
This “consumer” is essentially the tax-paying family, visualized as availing government services. The index, therefore, is somewhat analogous to the Consumer Price Index by Statistics Canada. While the latter gauges the cost of chosen goods and services for consumers, the former assesses the price tag of services the government provides to its citizens.
What’s Included in the Total Tax Bill?
To determine the complete tax liability of an average Canadian family, the Fraser Institute takes into account all taxes levied at all government levels— federal, provincial, and local. This encompasses income taxes, health taxes, property taxes, sales taxes, fuel and carbon taxes, import duties, taxes on vehicles, alcohol, and tobacco— are you out of breath yet? Because there’s lots more that we aren’t even going to list for the sake of lengthliness. Also, it’s noteworthy to mention that while businesses pay certain taxes directly, these costs eventually trickle down to everyday Canadians.

Delving into the Canadian Consumer Tax Index
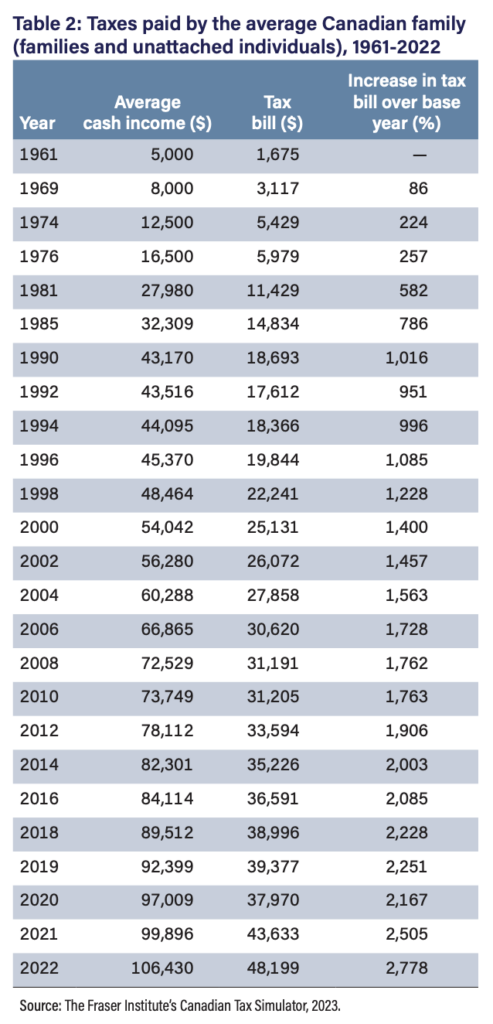
Once upon a time in 1961, the average Canadian family earned about $5,000 a year and coughed up 33.5% of that, or $1,675, in taxes. Fast-forward to 2022, the average family now reels in a robust $106,430 but pays a staggering 45.3% in taxes— that’s $48,199 if you’re keeping score. According to the Fraser Institute, that’s a jaw-dropping 2,778% increase since ’61. Indeed, inflation plays a role, but even when you adjust for it, taxes have still grown by 198.8% over the period.
Factors Influencing the Index
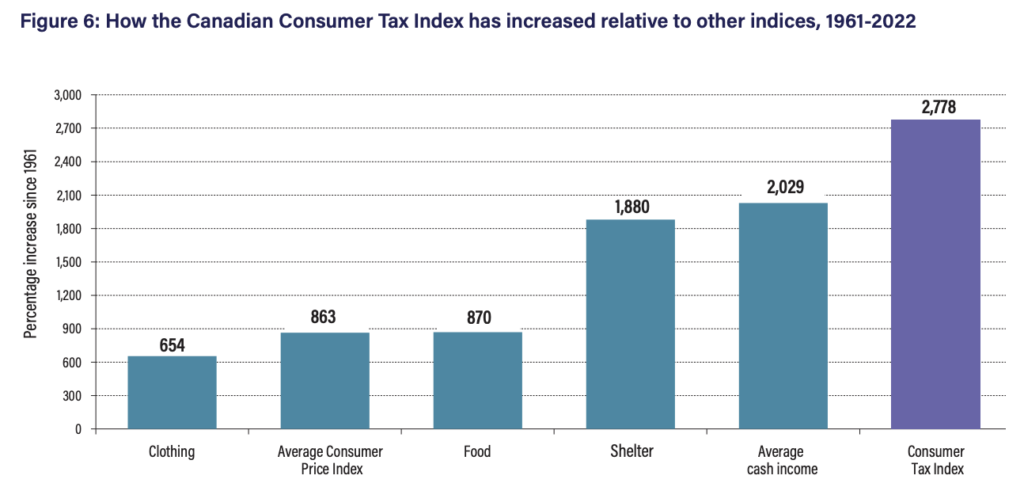
The substantial rise in the tax bill from 1961 to 2022 can be attributed to a mix of factors. Notably, there has been a 2,029% surge in incomes. Solely this income growth would have bumped up the tax bill from $1,675 in 1961 to $35,654 in 2022. Moreover, the average tax rate itself shifted from 33.5% in 1961 to 45.3% in 2022.
Don’t Forget About Deferred Taxation!
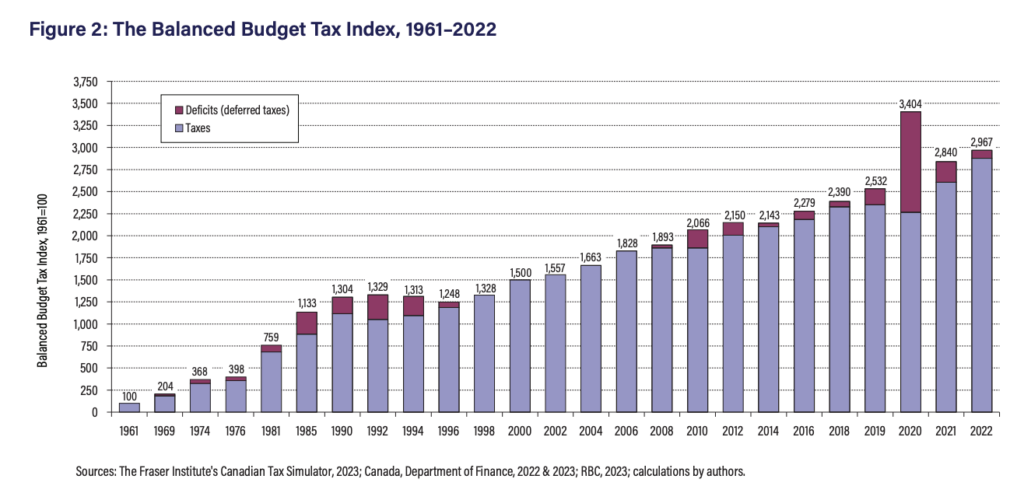
So, if you’ve got the idea that our modern Canadian governments are taxing and spending like a kid set loose in a candy store, you’d be right. But, they also do the adult thing: they use credit. Yes, they’re running bottomless deficits, which became notoriously evident during the Covid-19 pandemic. If those deficits are added as “deferred taxation” to the current tax bill, the Tax Index would shoot up even more to 2,967. Therefore, the true increase is a whooping 2,867% since the swinging sixties.
Taxes vs Essential Expenditures
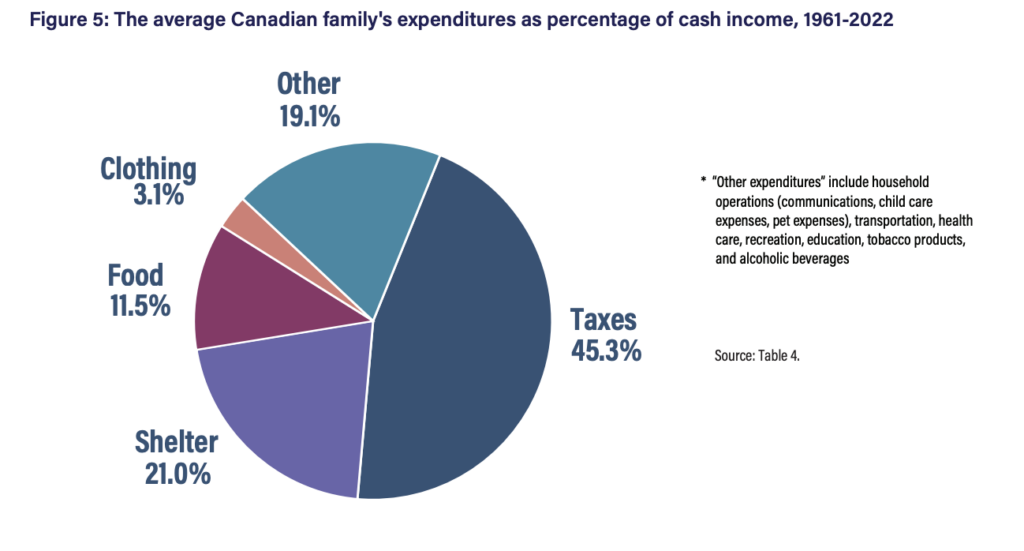
A revealing way to comprehend the tax dynamics is by comparing them with essential expenditures like shelter, food, and clothing. In 1961, families were spending 56.5% of their income on the boring but essential things— shelter, food, clothing. Taxes took a lesser 33.5% bite. Fast forward to 2022, and the essentials now take 35.6%, while 45.3% goes to the tax boogeyman. In terms of other expenditures between 1961 and 2022, while average incomes surged by 2,029%, expenditures on shelter, food, and clothing increased by 1,880%, 870%, and 654% respectively. In contrast, the tax bill skyrocketed by 2,778%.
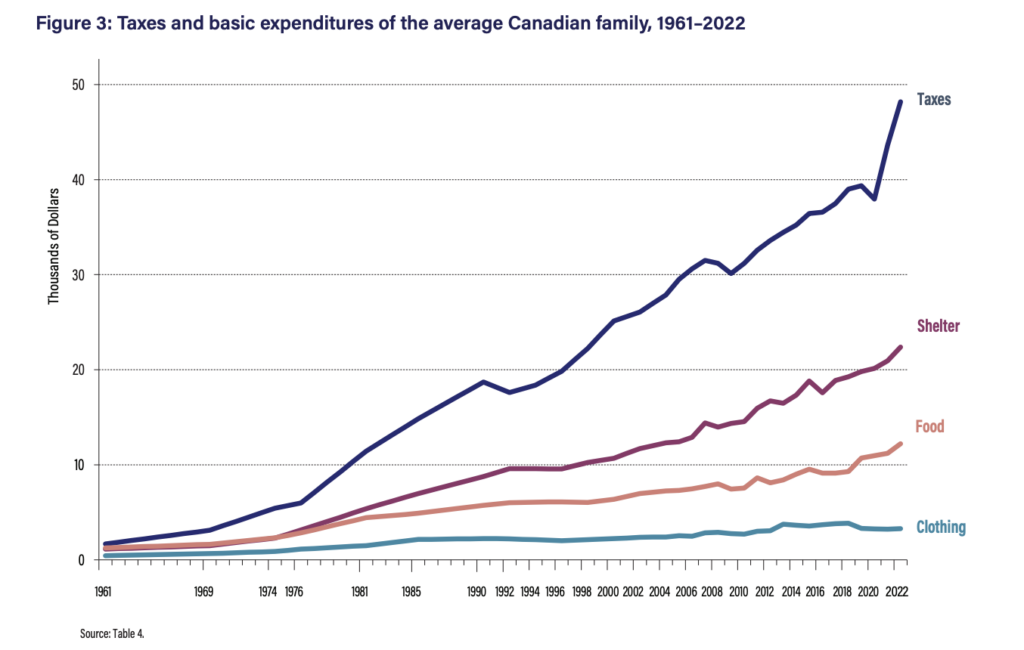
Interestingly, 2020 witnessed a brief dip in the tax bill due to the pandemic, but the subsequent years saw a bounce-back surpassing even pre-COVID levels. If budgeting was a board game, taxes just passed ‘Go’ and collected all your Monopoly money.
So, what’s the final takeaway? Well, if you’re in the “average” Canadian family, you’re shouldering a tax bill that’s astronomically heavier than it was six decades ago. The Canadian Consumer Tax Index does what good indexes do — provide hard data to either validate your fiscal paranoia or make you wish you were back in the good old days, financially speaking.
Information for this story was found via the Fraser Institute. The author has no securities or affiliations related to the organizations discussed. Not a recommendation to buy or sell. Always do additional research and consult a professional before purchasing a security. The author holds no licenses.