
Rising mortgage interest rates and worsening home affordability are buffeting home prices and pressuring equity markets. The bad news is that stock prices may still be too high for the current level of mortgage rates and for the stretched wallets of homebuyers.
The graphs below show 30-year fixed mortgage rates in the U.S. since 1970 and movements in the S&P 500 Index since that same year.
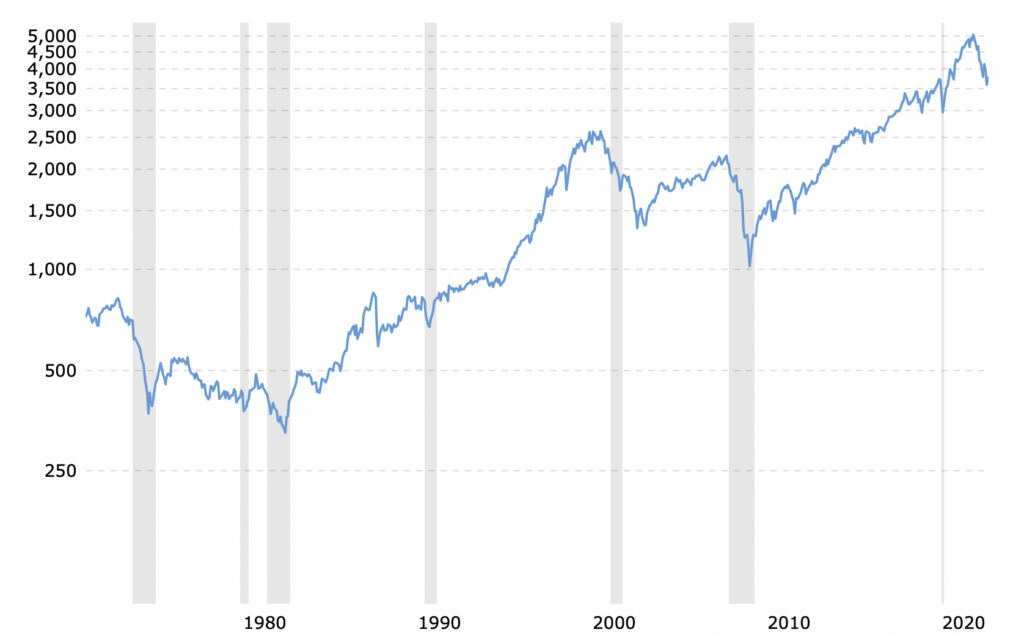
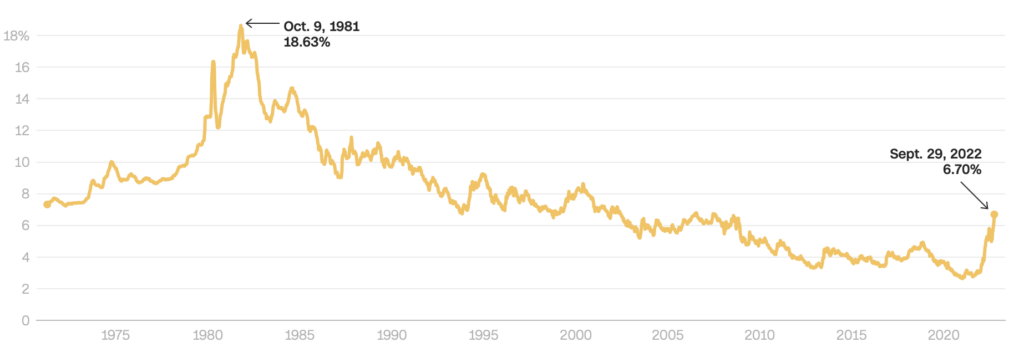
Not surprisingly, stocks and mortgage rates have been negatively correlated for the last half century. Stocks have followed somewhat more of a zigzag path than mortgage rates, which went down in almost a straight line fashion over most of this period, but the inverse linkage is striking.
Now, with current mortgage rates spiking to 6.84% and little reason to believe a reversal is in the near-term cards given the Fed’s oft-articulated hawkish monetary stance, it appears that stocks have more downside before index levels trade consistent with the new mortgage rate regime.
While much has changed since the early 2000’s — corporate earnings are much higher now, although inflation is too — that was the last time that mortgage rates were at about the same level they are now. In the early 2000’s, the S&P 500 Index traded at around 1,800.
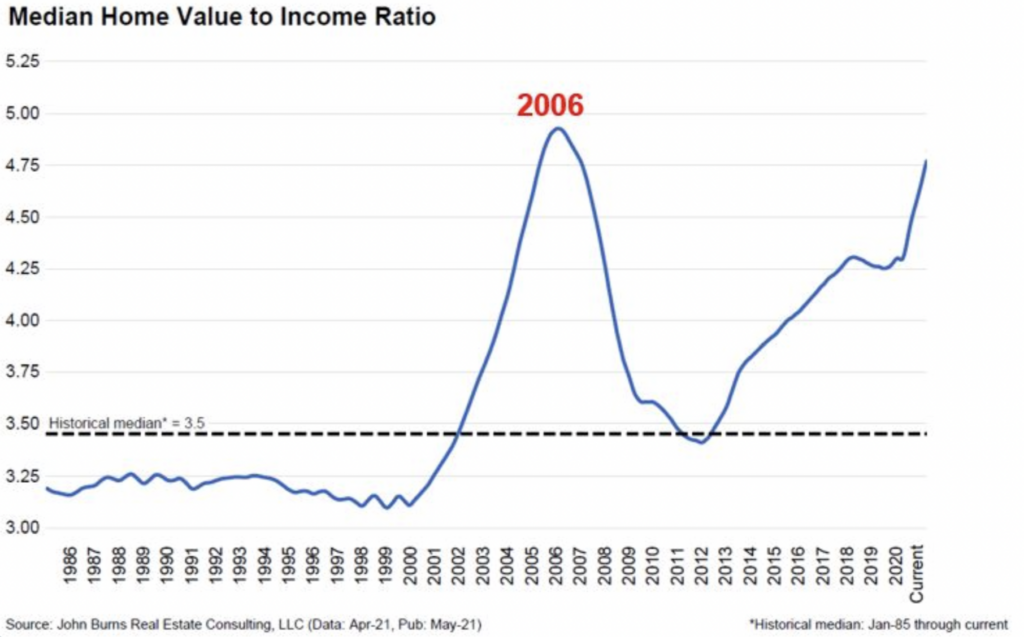
According to Black Night, a mortgage data company, and John Burns Real Estate Consulting, homes are less affordable in the U.S. than they have been in decades, even during the height of the real estate bubble in around 2005. The typical U.S. home, with a median price of around US$435,000, is equivalent to just over six times the country’s US$71,000 median household income. In 2005, that ratio hit about 5.5x, by some estimates, and has averaged about 3.5x over the last 35 years.
Phrased another way and quite surprisingly, U.S. houses are less affordable now on the basis of required mortgage payments than they were when interest rates were much higher in October 1986. We do note that current mortgage payments are much less painful than they were in October 1981, the time of peak mortgage rates.
| U.S. Mortgage/House Price Data (in U.S. dollars) | Mortgage Rate | Median U.S. Home Price | Monthly Payment | Median Monthly Income | Payment as a % of Income |
| Current | 6.84% | $435,000 | $2,061 | $5,917 | 35% |
| October 1986 | 9.97% | $91,488 | $640 | $2,133 | 30% |
| October 1981 | 18.45% | $70,398 | $870 | $1,582 | 55% |
Per Black Knight, a homebuyer today must dedicate 35% of their monthly income to cover mortgage payments assuming a standard 20% down payment and an excellent credit history. In 1986, when mortgage rates were nearly 10%, a homeowner had to plunk down just 30% of monthly income to pay the mortgage. In 1981, when mortgage rates were 18.45%, that income percentage was a staggering 55%.
Information for this briefing was found via Edgar and the sources mentioned. The author has no securities or affiliations related to this organization. Not a recommendation to buy or sell. Always do additional research and consult a professional before purchasing a security. The author holds no licenses.