
The negative 77-basis point (bp) yield spread between the U.S. two-year Treasury note (4.35%) and the U.S. ten-year government bond (3.58%) is the most deeply inverted differential since the dark economic times of 1981 An inverted yield curve generally suggests investors are worried about the economy’s long-term prospects; they are lending their money out for the long term at rates well below short-term rates.

In such a case, investors generally believe that the Fed will need to slash interest rates soon to revive a faltering economy. Of course, the extremely unusual aspect of all this is that the Fed not only does not plan to cut interest rates anytime soon, it plans to continue raising them for some time — perhaps by a further cumulative 100 bp or more. The deeply inverted yield curve may be flashing a warning signal that such actions will cause a sharp economic downturn.
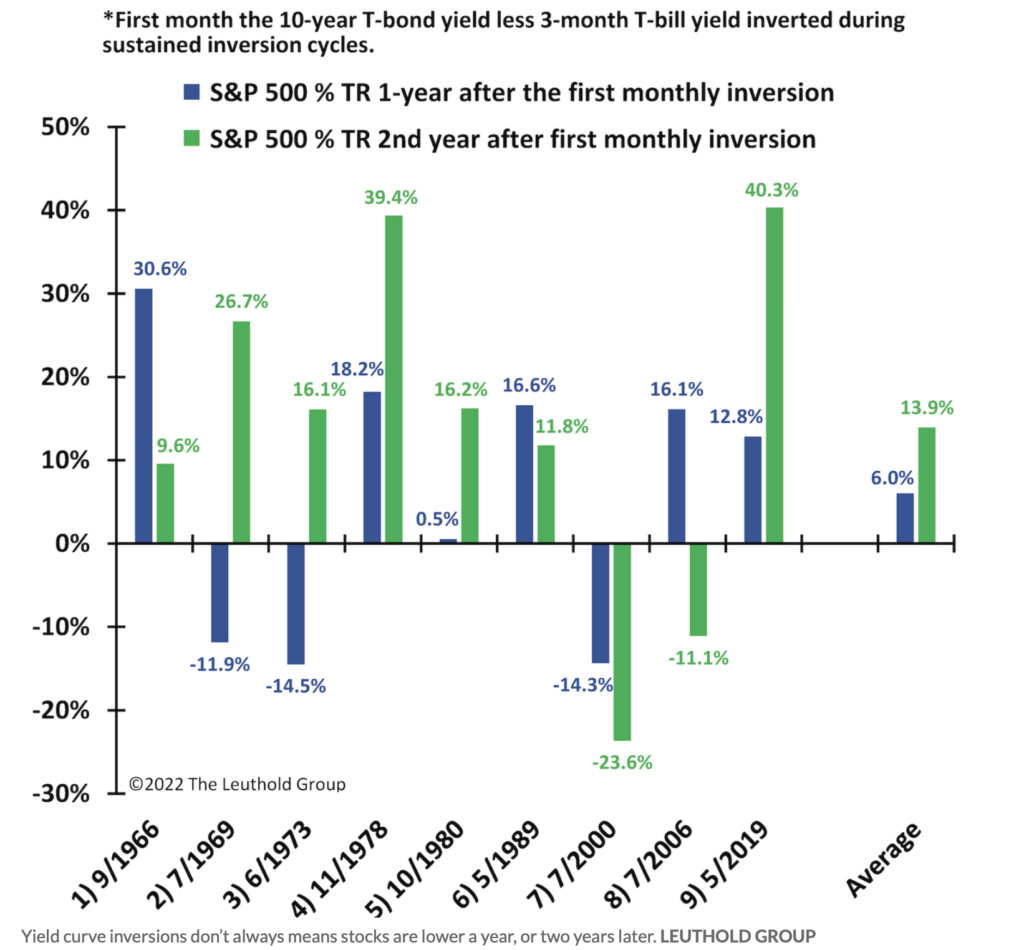
While none of this sounds constructive for the equity markets, the Leuthold Group recently published a fairly bullish take on the potential for stock market performance over the next year or two in light of the yield curve inversion. Specifically, the firm notes that since 1965, the annual total returns of the S&P 500 in the one and two years after an inversion occurred have averaged positive 6% and positive 14%, respectively.
To be fair, Leuthold’s study is based on defined inversions between the yields on U.S. three-month Treasury bills, currently 4.30%, and ten-year U.S. government bonds. The difference between those calculations and the more traditional two-year/ten-year negative spread is quite small. For example, the current yield differential between a three-month bill and a ten-year bond is negative 72 bp.
On the other hand, the last time the yield curve reached the current level of inversion, in 1981, some characteristics of the economy were reasonably similar to that of today. Most notably, inflation was roaring, reaching double-digit levels, and the Fed was raising interest rates aggressively to combat rising prices. Of course, there were major differences well. The economy was much less vibrant in 1981; U.S. unemployment rates were in the high 8% range then, dramatically higher than the current 3.7% figure.
Corporate funding markets might be sniffing out better times ahead. They seemed nearly closed around mid-year 2022, but they appear to be thawing. Investor demand, particularly for investment-grade bond new issuances, has picked up in recent days.
This improvement is reflected in the Corporate Bond Market Distress Index (CMDI), which is a broad measure of the health of the funding markets created and prepared by the New York Federal Reserve. The CMDI, which reflects such elements as primary market issuance and pricing, secondary market pricing, and liquidity conditions, was showing fairly high levels of distress a few months ago — in particular, the investment grade sector was displaying distress levels near the brief peaks at the start of the COVID pandemic. However, the overall market now reflects only the average level of distress seen over the last 20 years.

Information for this briefing was found via Trading Economics, Bloomberg, The New York Federal Reserve and the sources mentioned. The author has no securities or affiliations related to this organization. Not a recommendation to buy or sell. Always do additional research and consult a professional before purchasing a security. The author holds no licenses.