

A ratio which tracks the daily issuance of Bitcoin to cryptocurrency miners has moved into a range which in the past has preceded a downturn in the digital currency (see graph just below). The Puell Multiple, which is computed daily, is the U.S. dollar value of all Bitcoin mined that day (“new Bitcoin”) divided by the 365-day moving average of the value of Bitcoin mined.
The theory behind the simple formula is that when the ratio gets too high, Bitcoin miners feel compelled to sell Bitcoin because the U.S. dollar value they have received for mining the digital currency today is so much higher than the average U.S. dollar value they have received over the last year. The ratio has risen in recent months because of Bitcoin’s explosive move over that period. After all, Bitcoin was below US$20,000 as recently as mid-December.
On the flipside, when the Puell Multiple is low, Bitcoin miners generally feel that selling the Bitcoin they have mined today offers too little a reward, prompting them to hold the cryptocurrency in hopes of selling later at a better price.
Phrased another way, during those periods in which the value of “new Bitcoin” entering the economy is too large or too small, the price of Bitcoin has historically followed the traditional laws of supply and demand — the market has self-corrected.
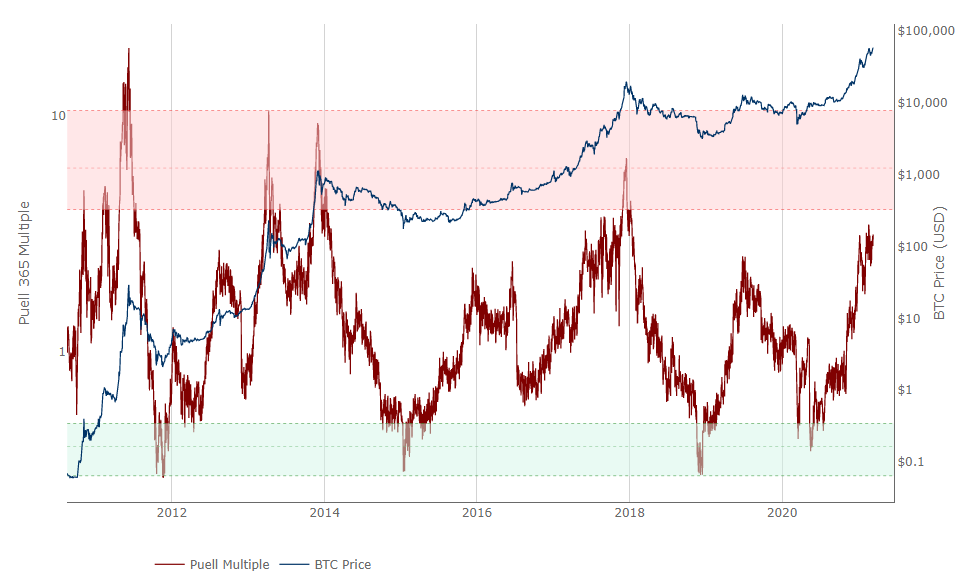
Over the past ten years, a Puell Multiple movement into the upper red area of the chart has coincided with at least an intermediate-term top in the price of Bitcoin. Interestingly, a movement down to the green area has frequently signaled a Bitcoin price bottom, but the correlation in those cases seems less direct.
Of course, it is possible that “things could be different this time.” At the other times that the Puell Multiple reached the red area of the graph, the Bitcoin market was almost exclusively the province of retail investors. As many institutions (Tesla, MicroStrategy, Square, and others) have become Bitcoin buyers (and to a much lesser degree, sellers) over the last few months, the dynamics of Bitcoin value supply and demand may have changed, making the Puell Multiple less predictive.
While not a foolproof signal, the Puell Multiple’s approaching of the red zone of the above graph may be a red flag for Bitcoin. After all, the digital currency has appreciated more than 400% over just the last six months, far outpacing virtually all other asset classes.
Information for this briefing was found via Sedar and the companies mentioned. The author has no securities or affiliations related to this organization. Not a recommendation to buy or sell. Always do additional research and consult a professional before purchasing a security. The author holds no licenses.