
A sharp drawdown in the gold price this past Tuesday stuck those of us betting the delayed-inflation trade with a gut-wrenching coaster-drop feeling. The 6% drop followed a 3% drop Friday that gold longs were eyeing up as a reasonable bull-market correction.
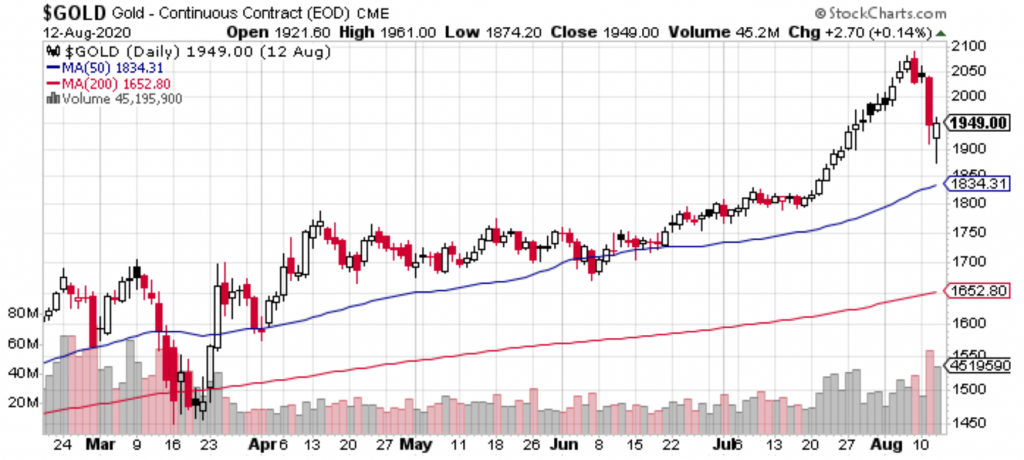
The long gold trade had a feeling like it was out at the lake all weekend, drinking beer and thinking about how a 3% Friday drop didn’t have them the slightest bit worried. A bit of profit taking was natural at this phase. Up 18% in a month… busted through $2,000/oz… some cashing out is to be expected. It’s right on schedule. “Not me, though,” they were thinking, as they popped another beer and blew the foam off the top. “I’m in this for the long haul. Standing pat.”
But a “this-is-fine, hold fast,” attitude doesn’t move markets. Tepid complacence moves a trade sideways on a good day. They climb on a violent and stark desperation – when the longs clamer on about it with greed in their voices giving their friends a fear that they might miss out, and bringing them trampling into the trade. If nobody’s desperate, there aren’t any immediate buyers, and if there aren’t any immediate buyers, why hang around?
 Sponsored · Selkirk Copper Mines
The less entrenched positions took off, leaving the true believers and late entries with poor timing on a falling elevator. The covers and opportunists sent it green on Wednesday. Following the gut check, the immediate movements will have to do with what sticks hardest in the collective market’s mind – gold’s month-long aggressive staircase climb or its two day violent drop.
The Bull Tries to Shake You Off
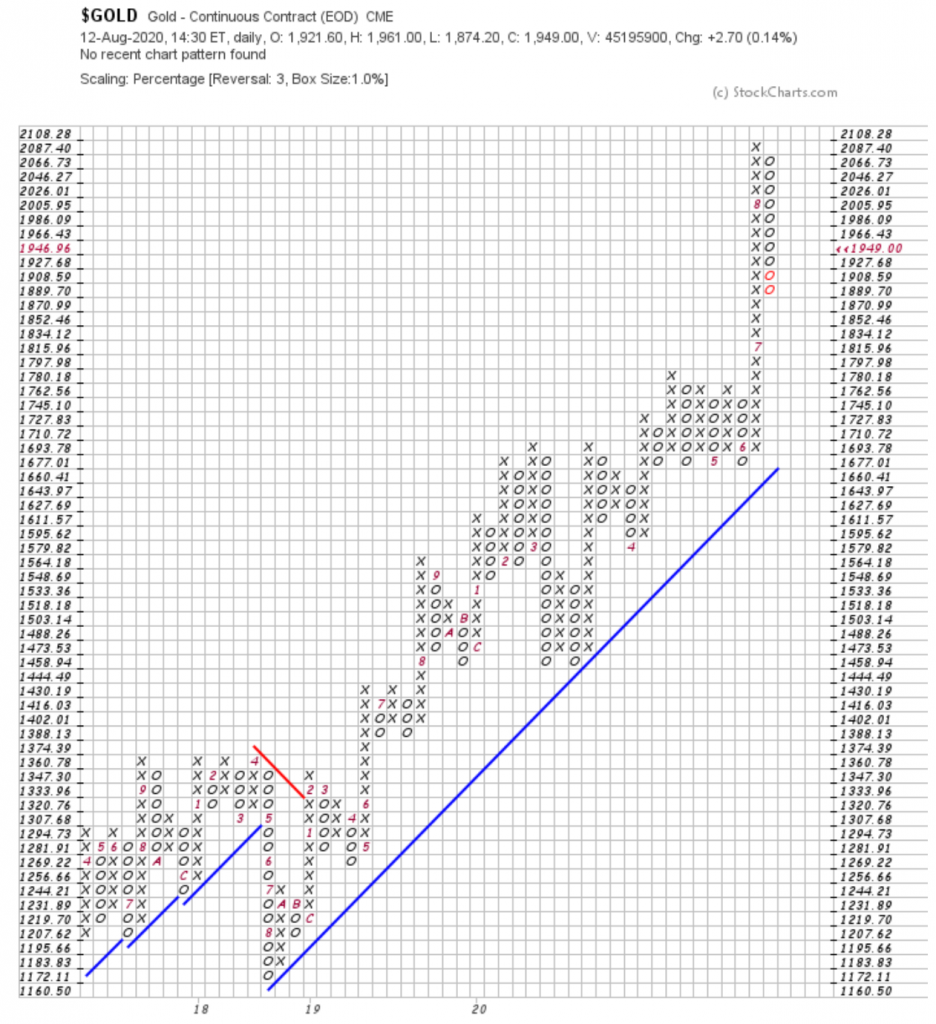
The point and figure chart (1% boxes, 3 box reversal) reminds us that this correction is the latest chapter in an absolutely WILD ride for gold. It’s a retracement of the third and longest break that gold has gone on this year, the fourth if we start in December. It goes effectively sideways for three years before the May 2019 breakout, through a period when next to nobody was thinking much about the apocalypse.
The Paradox
The basic gold bug notion that there are unlimited dollars and a finite amount of gold, and so gold, in dollar terms, stands to appreciate as more and more money is printed, is pretty solid. It’s simple to understand and explain, and has a nice ring to it, which is all these things need to grow roots, but it isn’t to be mistaken for any kind of exact science. It’s a concept that manifests itself through the imperfect mechanism of the markets. Those markets are denominated in US dollars, and traded by people who are chasing them. While gold may be money, it isn’t currency, so we can expect it to be subject to the downward pressure of sellers looking to cash out for as long as the US dollar is still the transactional reserve currency used to buy things.
The Fear Trade Needs Fear
The runaway interest in gold represents investors’ fear that the Federal Reserve may print enough dollars to dilute their value to the point that they are no longer used as a reserve currency. It may be that it already has, and it will become apparent when the printed dollars work their way into the economy. Inflation manifests itself sporadically as price spikes in popular goods and services that just never go away.
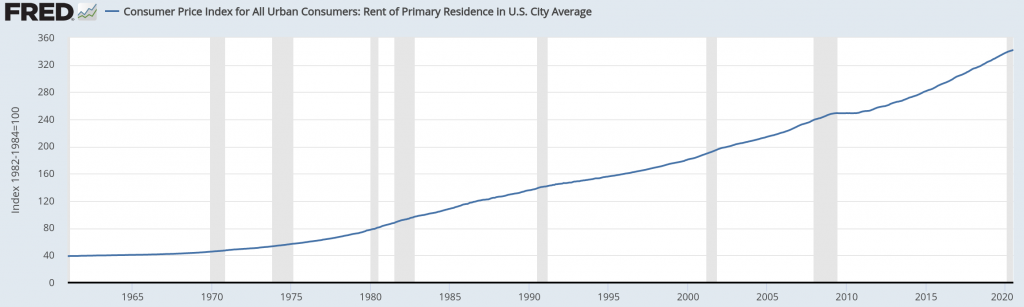
The most obvious and glaring runaway price spike is the one in urban rent and the price of real estate. Housing is something everyone needs and nobody is prepared to discount until it’s absolutely necessary. Since rent is a cost (or income), and not a tradeable commodity, it isn’t subject to the same erratic noisy swings as gold. The rental backlog and looming eviction crisis is evidence of the battle between inflation and deflation in the housing market, and more evidence that, at lest in the near term, everyone is still chasing dollars.
 Sponsored · Cambria Gold Mines
The Theory of Monetary Relativity
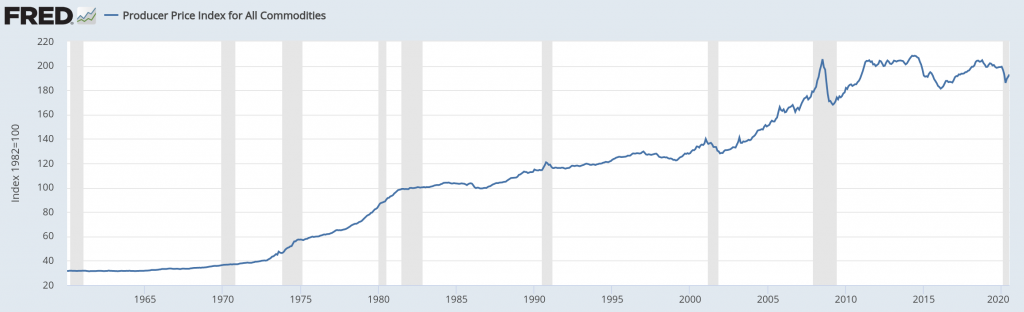
The dollar buying less and less over time is practically a foregone conclusion. That’s how this racket works. The US Government borrows dollars by selling Treasury Bills and, but they time it’s due to be paid back, the dollars that the treasury uses to pay it back are worth considerably less than the ones that were borrowed. This is evident from a look at an extended gold chart and, in fact, a chart of mostly any asset denominated in dollars. Property…
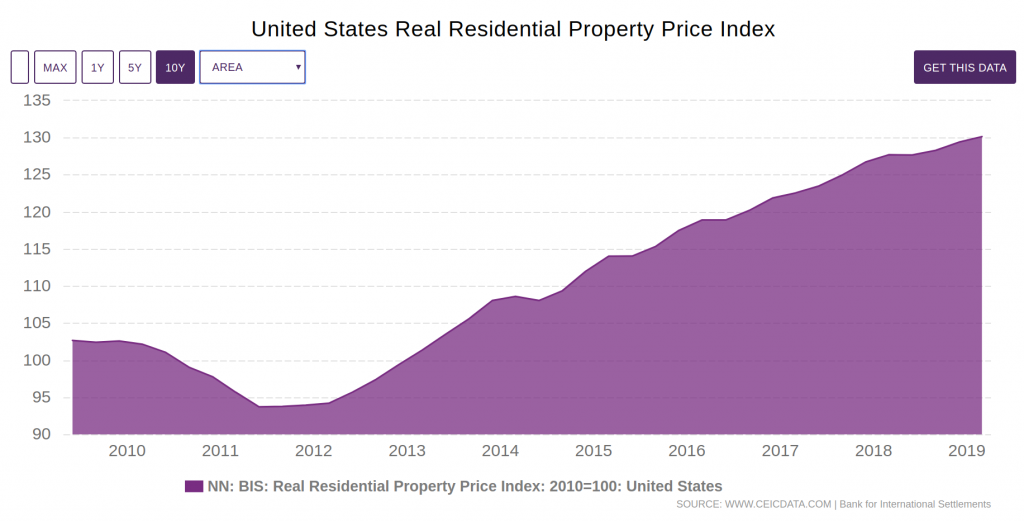
commodities…
equities…
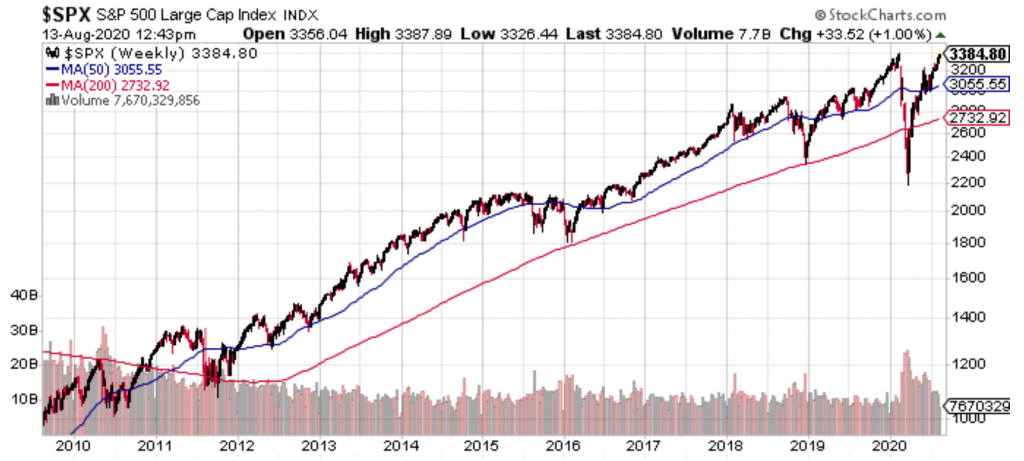
and that’s ultimately the complication with being long gold. Its dollar-devaluation-driven growth is relative.
The fact that there are fewer above-ground ounces of gold per dollar all the time isn’t what drives the gold bull. Investors betting that the dynamic will cause gold to out-pace other assets in dollar terms is what dives the gold bull. And investors are a fickle bunch. They’re liable to follow crowds and jump on and off of bandwagons in a self-fulfilling prophecy that money follows money, causing markets to behave the way they do.
Accordingly, markets never get where they’re going in a straight line. Our job is to read the trends, decide on the direction they’re most likely to travel over our time horizon, and bet accordingly. For now, anyway, the bull-trend is still intact for gold. We’ve adjusted the parameters of the point and figure chart every way we can think of to make it show this latest downward move as a breakdown, but it won’t co-operate.
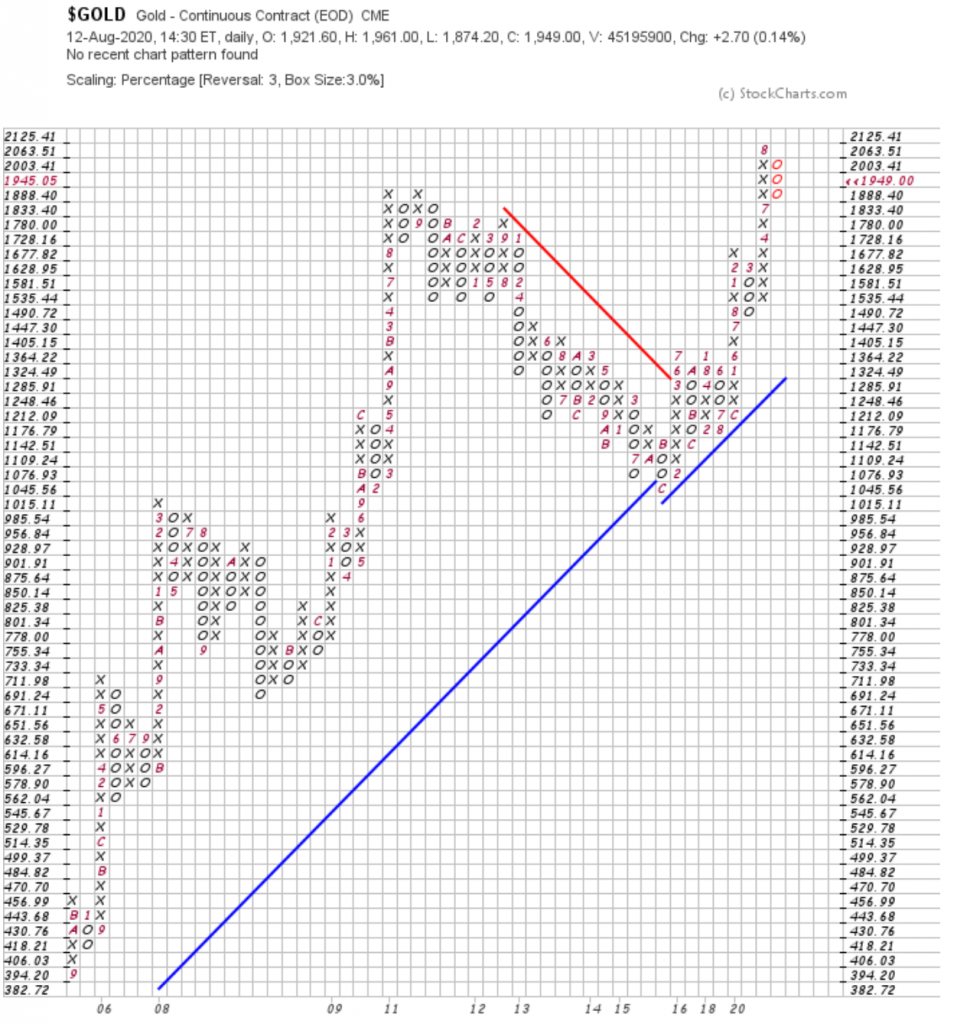
Gold has found support here, however briefly, and isn’t ready to fall apart quite yet. But the trend is becoming more delicate, and the next move will tell us a lot. This gold chart is asking investors if they would like one last chance to climb aboard, or if the party is over.
Information for this briefing was found via Sedar and the companies mentioned. The author has exposure to gold through ownership of physical gold and gold mining companies, but otherwise has no securities or affiliations related to these organizations. Not a recommendation to buy or sell. Always do additional research and consult a professional before purchasing a security. The author holds no licenses.