

Continuing a pattern which began in the early fall of 2022, and which has accelerated over the first five weeks of 2023, investment-grade and high yield bond spreads versus U.S. Treasuries both continue to narrow. This implies that bond market participants foresee little chance of an economic downturn in 2023. Equity investors broadly seem to be drawing similar conclusions given the red-hot start to 2023 that many risky stocks have enjoyed.
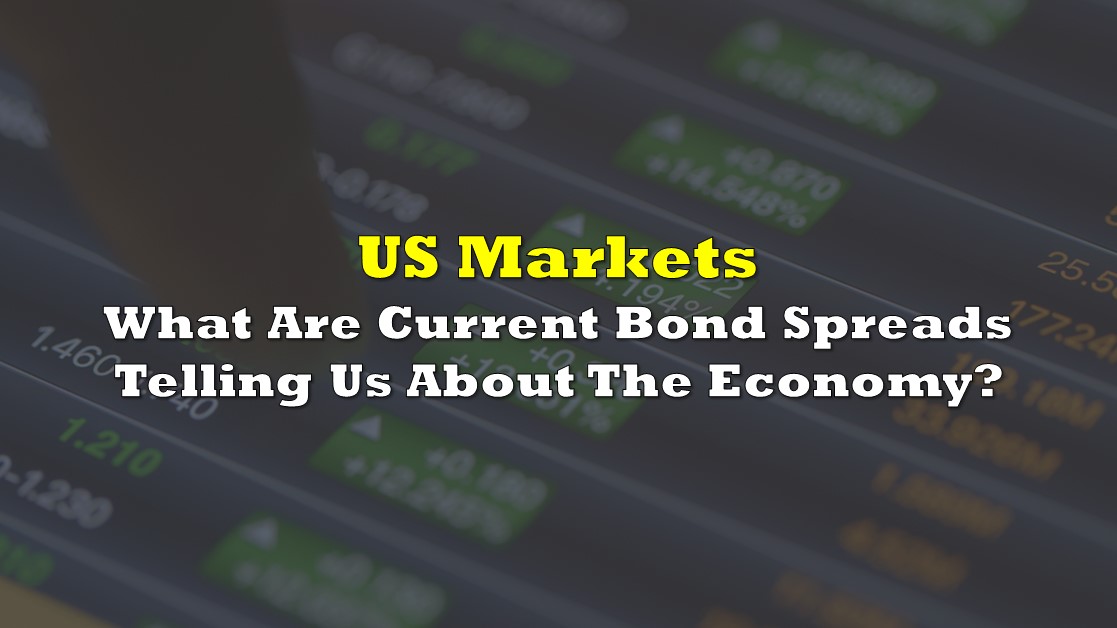
According to ICE-Bank of America index data, junk bond spreads have declined to less than 400 basis points (bp) versus 550 bp in late September 2022. Equally important, high yield bonds’ required yield premium versus Treasuries is now below the average level of around 450 bp seen over the last ten years. Investors seem little concerned that U.S. and Canadian high-yield default rates could jump to 3.0%-3.5% in 2023 from just 1.3% in 2022, per Fitch Ratings, due to “growing economic headwinds.”
During sharp downturns like the dot-com bust in the early 2000’s and 2008-2009 Financial Crisis, the extra yield necessary to offset the risk of a sharp downturn reached or exceeded 1,000 bp. Even for short periods in late 2011 and in 2016, the junk bond yield premium topped 700 bp for at least several months in each instance.
A marked improvement in investor receptivity to junk bond issuance represents additional anecdotal evidence of a constructive high yield bond market. According to Informa Markets data, 25 issuers sold more than US$20 billion of new junk bonds in January 2023. This represents more than the aggregate primary issuance activity recorded in 4Q 2022, when 18 issuers sold US$16.5 billion of new high-yield bonds.
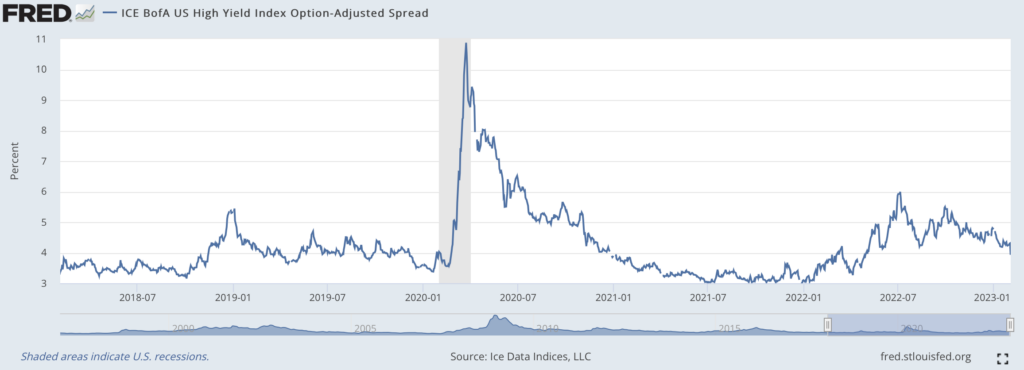
Investment-grade bonds have likewise staged an impressive rally over the last four months. The average yield spreads on those higher quality bonds have declined to around 120 bp from around 170 bp in October 2022. Furthermore, the current 120-bp yield premium versus Treasuries looks to be slightly below the average yield spread over the past decade.
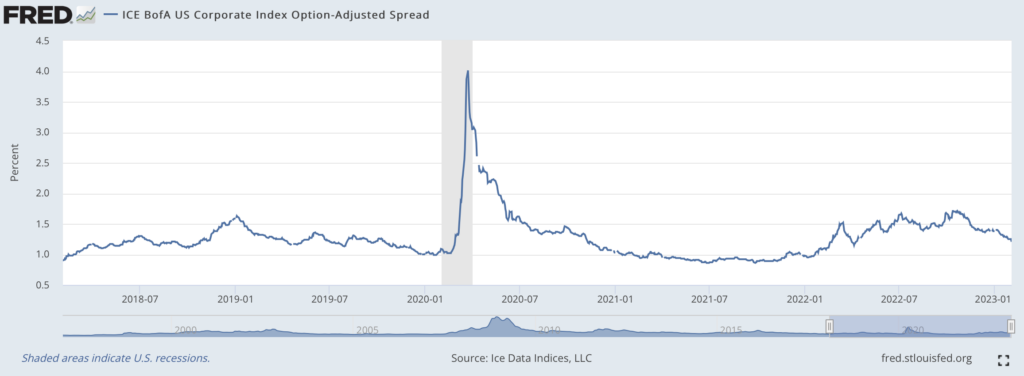
On the other hand, government bond investors have a much less optimistic view of U.S. and worldwide economic conditions later in 2023. The yield spread between the U.S. two-year Treasury note (4.35%) and the U.S. ten-year government bond (3.57%) is negative 78 bp, near the recent peak of a negative 80 bp differential in early December. The yield curve is essentially at its most inverted level since 1981.
An inverted yield curve generally suggests investors are worried about the economy’s long-term prospects; they are lending their money out for the long term at rates well below short-term rates.
In summary, the trading patterns of both high yield and investment grade bonds seem to confirm the optimistic tone of equity markets since the start of 2023. Nevertheless, an extremely unusual large negative spread between two-year U.S. Treasury notes and ten-year Treasury bonds does not provide full confirmation of the constructive pricing data in the corporate bond markets.
Information for this briefing was found via Edgar and the sources mentioned. The author has no securities or affiliations related to this organization. Not a recommendation to buy or sell. Always do additional research and consult a professional before purchasing a security. The author holds no licenses.


Bond Junkies: Federal Reserve to Start Buying High Yield Corporate Bonds
In the duration of a month, over 16 million of unemployed Americans have been desperately...