This is the first in a series of the posts about the banking system as examined through the collapse of Silicon Valley Bank, and its unfolding effect on the broader economy.
Silicon Valley the place, and Silicon Valley the socio-economic bubble are funny enough that someone made a pretty good comedy about it called Silicon Valley the TV show.
When the financial organ that linked the tech bubble’s economy to the broader economy suffered a sudden and dramatic failure, it seemed funny, because it looked like a bunch of insufferable, app-making billionaires with inflated opinions of their own contributions were going to lose a lot of money that they definitely didn’t earn.
Measures being taken by the Federal Reserve and Federal Deposit Insurance Company meant to preserve depositors’ money to avoid this causing a collapse of the entire banking system made it less funny at first, but even funnier when you think about it.
READ: What Happened at Silicon Valley Bank?
After all; it was the Federal Reserve’s idea to charter a “Silicon Valley Bank” in the first place.
Regulators hastily nailing up a piece of plywood to patch up a hole in a metaphorical economic building that is trying its best not to fall down, while insisting that everything is fine, means it’s high time we examined this structure for flaws.
Part 1: Reserve Ratios
In banking, the reserve ratio is the percentage of a bank’s deposits kept on hand in cash and liquid securities to satisfy on-demand withdrawals. Bank reserves consist of safe, liquid securities like high-grade government bonds.
In the United States, the Federal Reserve has the sole discretion to set reserve requirements for banks. On March 26, 2020 the Federal Reserve’s board of governors set the reserve requirement at 0%.
The unusual measure was meant to increase the total liquid cash available, and lubricate an economy that was seized up by pandemic lockdown. The Fed still calculates and publishes what the reserve minimums would be, but the ratio of reserves to deposits that a US bank is required to keep remains 0%.
There is no law requiring that a person own pants, either, but that doesn’t make not having any a good idea. All banks have reserves, all of those reserves are affected by the capital markets, and how the reserves are managed in the context of the capital markets has everything to do with how sustainable the bank is as an enterprise.
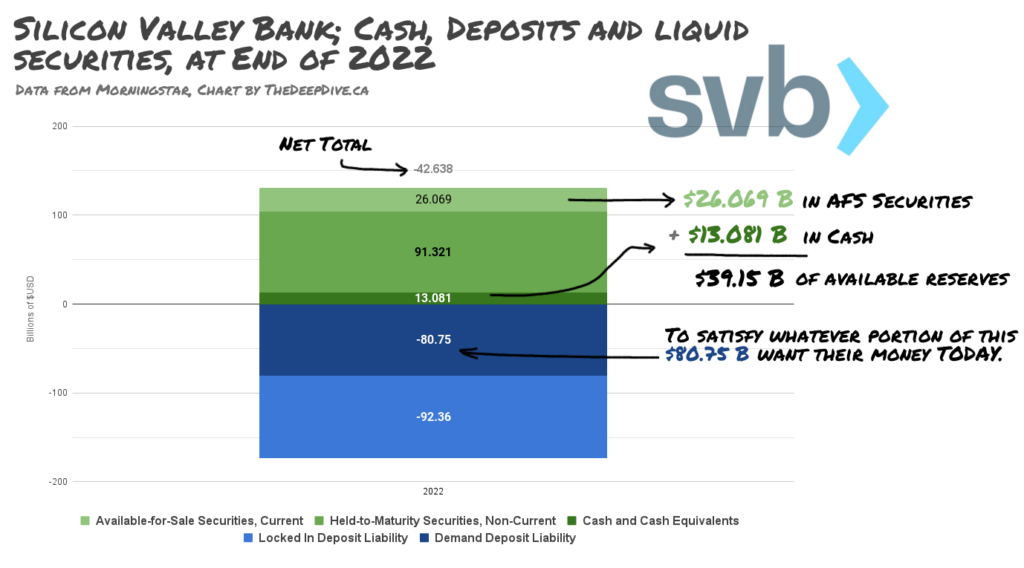
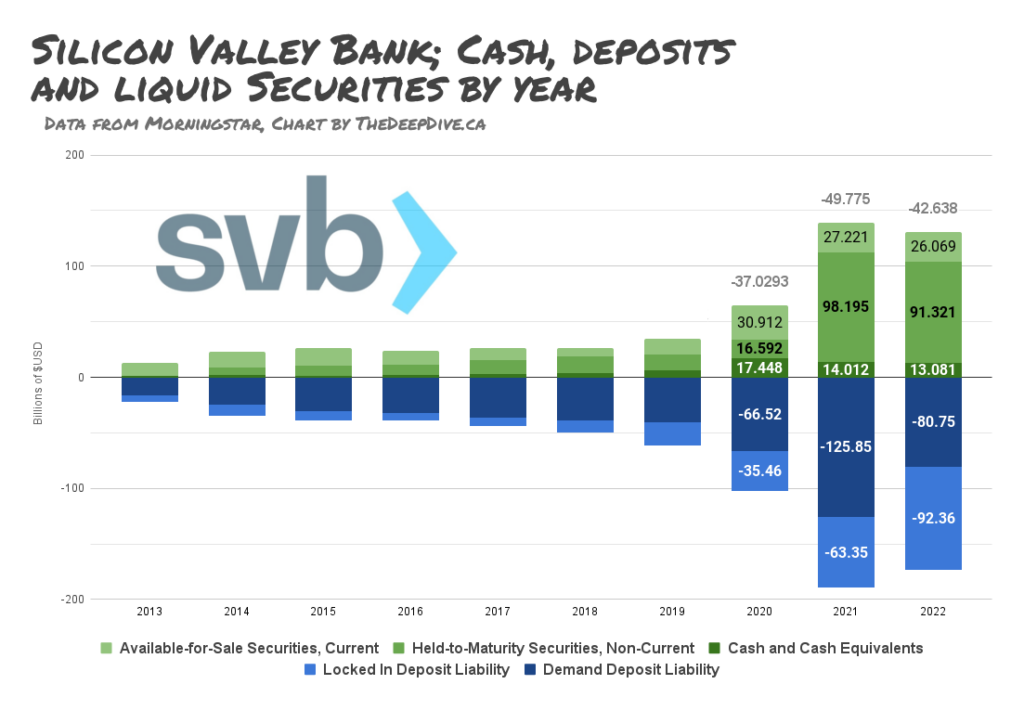
This chart is a decent look at how SVB’s managed its reserve ratio, generally. The main difference between the categories is time: Locked-In deposits are term deposits that forfeit their interest if withdrawn before the term ends. In a bank run, depositors aren’t interested in the interest, but let’s evaluate this balance sheet through a pre-panic lens, and assume the $92.3 billion in term deposits are staying put.
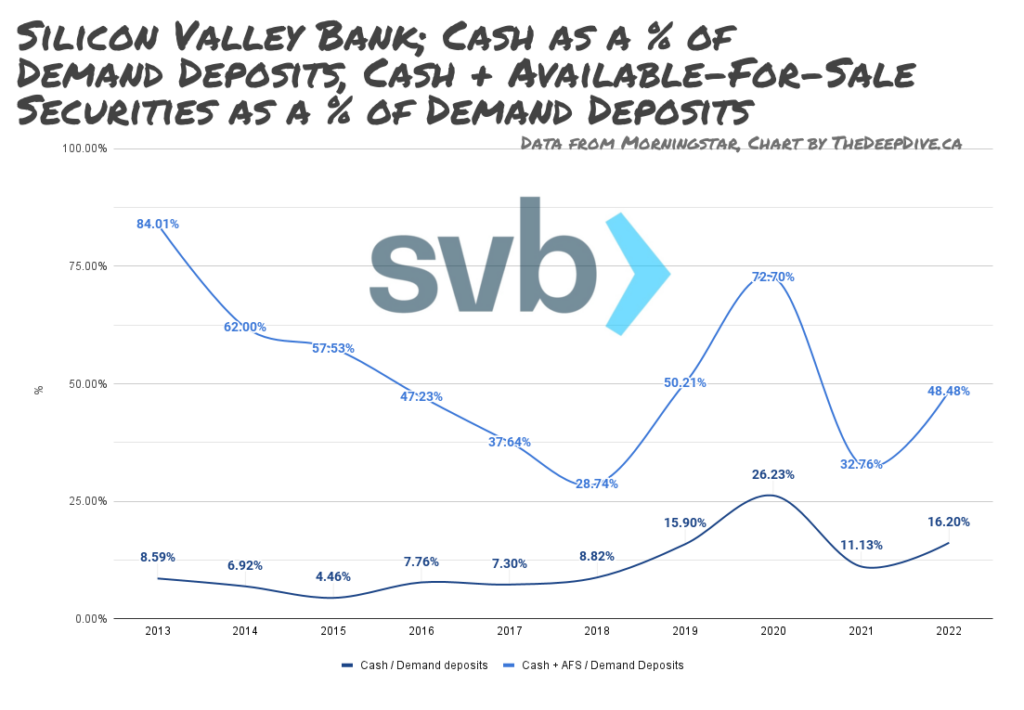
At the end of 2022, the $13.08 billion in cash that Silicon Valley Bank had in its vault covered 16.2% of its demandable deposits. If it were to run into more than that in net withdrawals, it would have to dip into its reserves, and sell some of those available-for-sale securities.
Liquidating the $26 billion in available-for-sale securities would make SVB liquid for about half of its demand deposits. That would be a good start. Let’s take a look at the 10-K to get an idea of what they were working with.
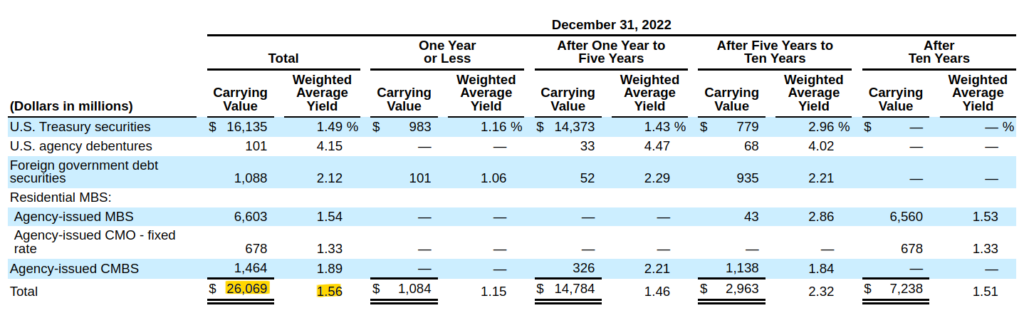
SVB has a nice, respectable portfolio of good, safe fixed income securities here (“fixed income securities” is what people call bonds when they want to sound smart). Most of it is US Government Treasury paper that matures in 1 to 5 years.
As a portfolio, it is $26 billion dollars worth of bonds that produce 1.56% in annual interest.
Before this gets too exciting, we’re going to have to have a talk about bond yields.
Bond Yields
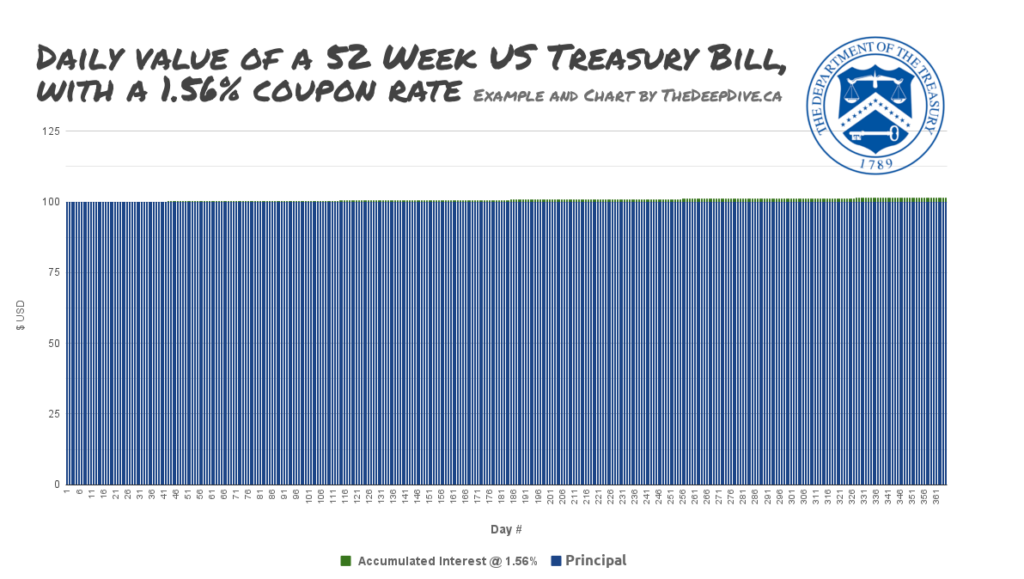
This is the principal and interest on a 52 week US Treasury Bill that pays 1.56%. The principal is taking up all the real estate on the chart, so let’s break the top out.
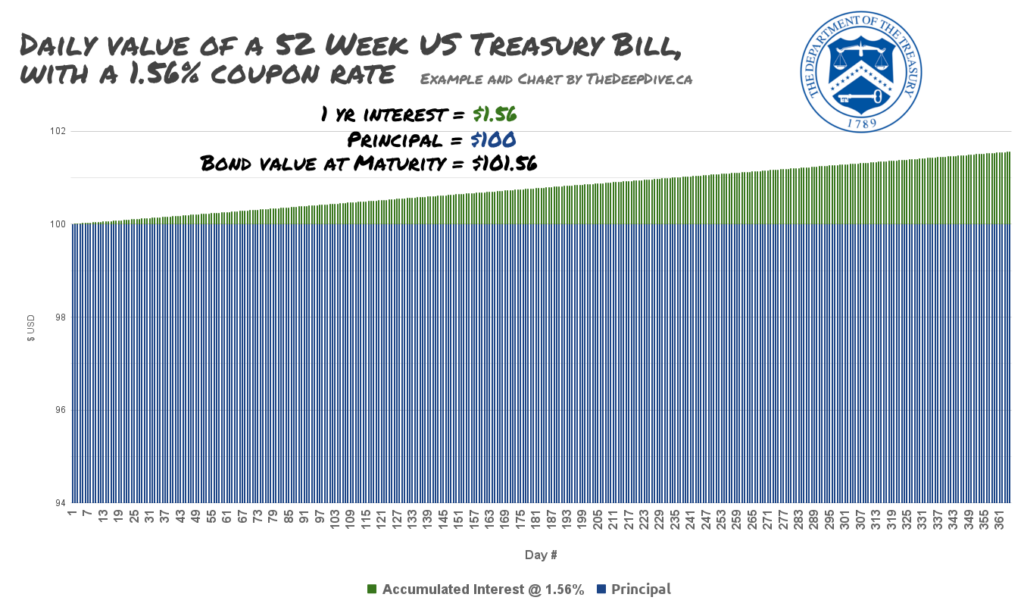
Much better.
Held to maturity, this instrument will be worth $101.56; the $100 in principal, and $1.56 in interest, paid to the bondholder by the United States Treasury.
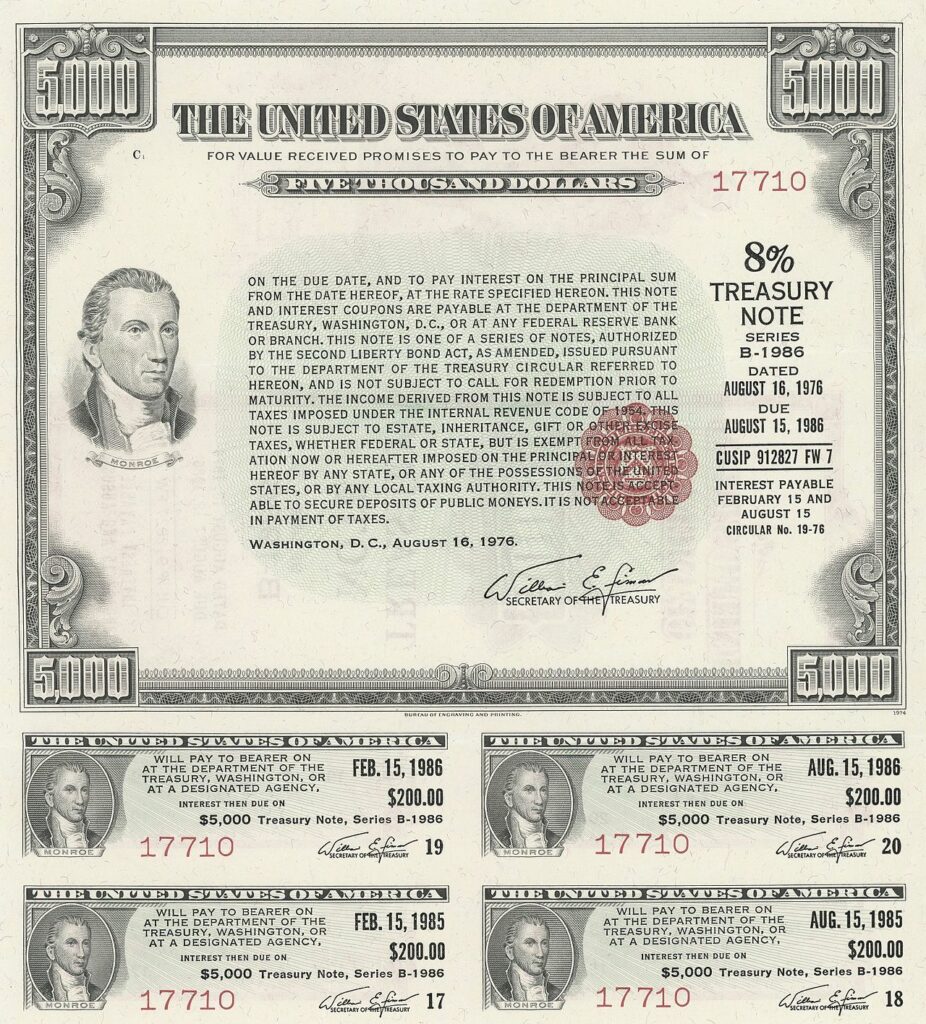
Before they invented computers, bonds came with attached coupons that could be redeemed for interest payments, so the rate that the bond issuer pays out to the bond holder is called the “coupon rate,” or “coupon yield.”
But they wouldn’t be “available-for-sale” securities if they didn’t trade on a market.
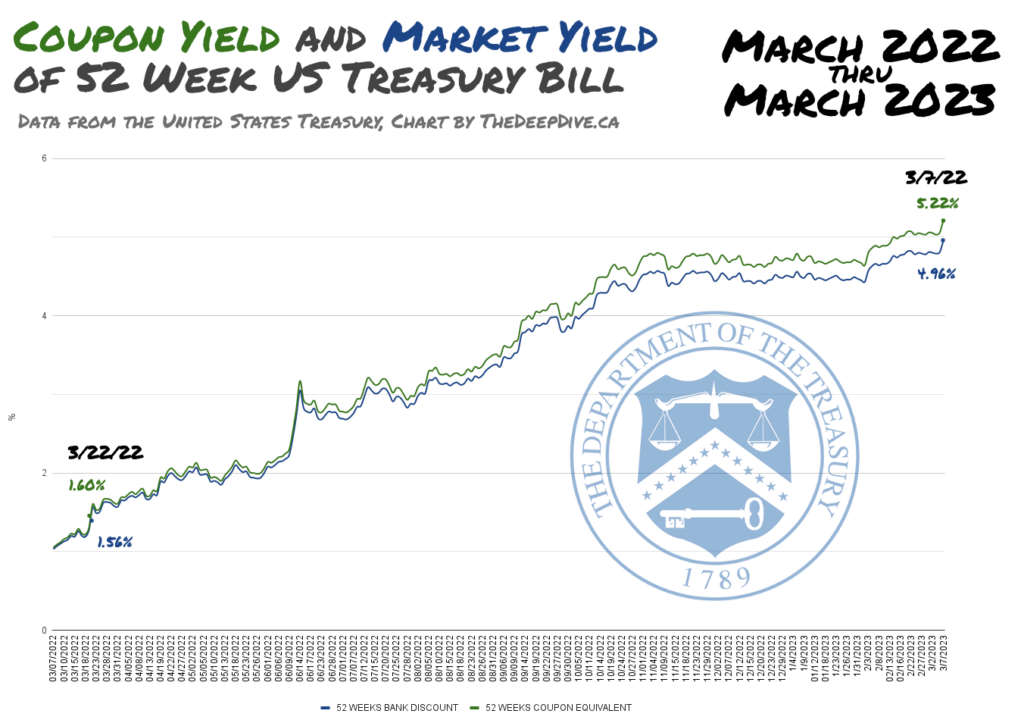
This is a chart of the yield of a 52 week Treasury Bill from March 7, 2022 to March 7, 2023 – the day SVB liquidated its available for sale securities.
Note: this is not a chart of the yield of a single 52 week T-Bill over that period. It is also not a chart of the price of the 52 week T-bill over that period.
It is a chart of what a 52 week T-Bill would yield if purchased on each of the 365 days charted, and held for one year.
There are two yields charted here: the coupon yield, which we’ve been over, and the “bank discount,” the yield available to someone who bought the bond in a secondary market, where most bonds are bought and sold.
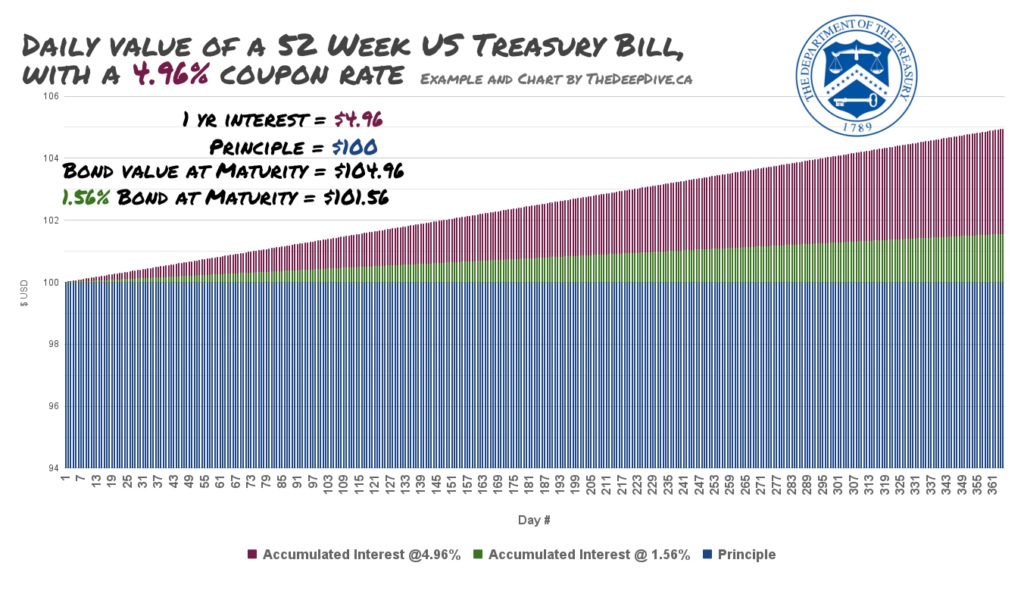
This is a 1 year Treasury Bill that pays a 4.96% coupon rate, held to maturity.
We’ve overlaid the yield from the 1.56% T-Bill that we used as a stand-in for SVB’s available for sale securities in green to show that, on March 7th, 2023, it has juicier bonds to contend with, so it isn’t as valuable.
“As yield goes up, price comes down.”
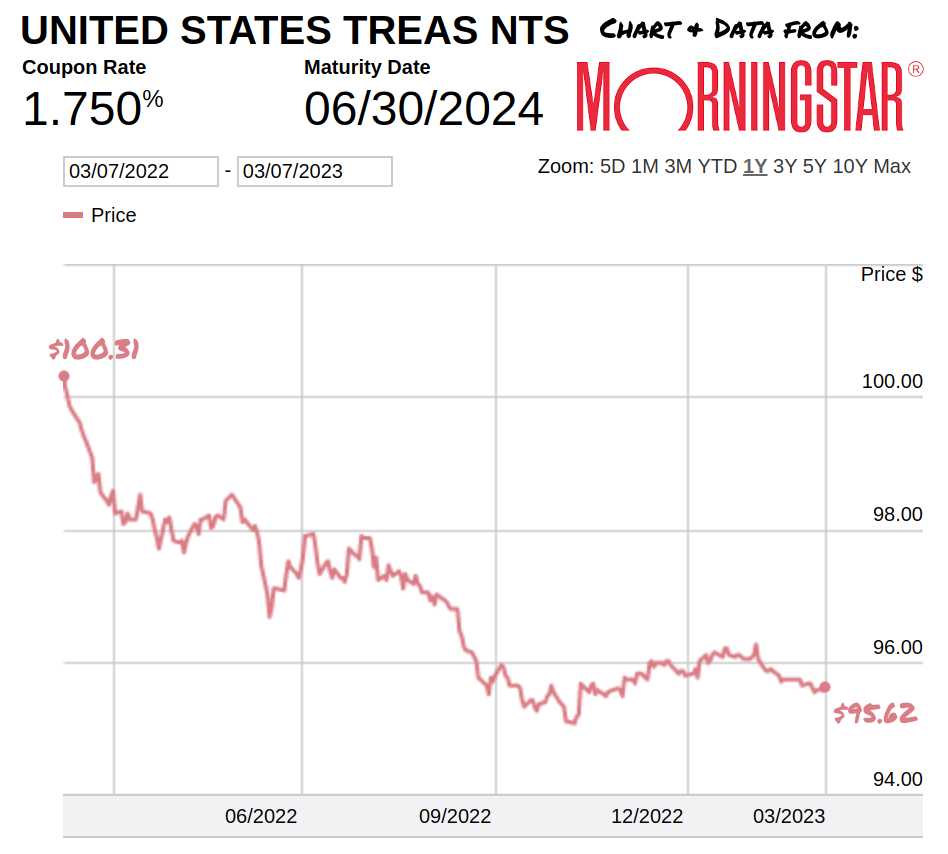
This one is a chart of price. Specifically, the price of a 5 year Treasury Note issued in 2019, maturing in 2024.
(We’ve been using the 52 Week T-Bill for our example, because it lines up nicely with annualized interest rates, but Treasury paper comes in all kinds of maturities. The yields are always quoted on an annualized basis.)
In March of 2022, this T-Bill traded for $100.31 and, if SVB owned it, that would have been its book value. If it was forced to sell it March 7th for $95.62; the discounted value that the market has given it, thanks to its relatively low coupon yield, then SVB would take a -$4.69 loss.

At the end of 2022, the move that the bond markets made in response to the change in interest rates meant the bank was carrying an unrealized loss of -$1.7 billion on its AFS securities portfolio: the difference between that paper’s value when SVB purchased it, and its market value in December of 2023.
If the bank could have held the $26 billion in AFS bonds to maturity, it would collect the coupon rate on the bonds, redeem them for their principal, and suffer no actual or paper loss.
But it couldn’t. It had to sell to meet cash demands, and that meant taking a loss somewhere in the neighborhood of -$1.7 to -$3 billion. Make no mistake: having to lock in that comparatively tiny loss is what ended up sinking this bank.
$2 billion doesn’t sound like much. Not for a bank with $35 billion in credit with the Federal Reserve and Federal Home Loan Bank. According to Reuters, $40 billion was withdrawn from the Fed by SVB in the days before the collapse, and has since been returned to the Fed by the FDIC receivers now in control of the bank… so it never did make its way to depositors.
It really doesn’t sound like much compared to $211 billion in assets, $74 billion of which were outstanding loans. And it’s hard to imagine it coming up $2 billion short of the deposit liabilities that needed to be covered with all that Fed Credit.
But assets and liabilities are only two thirds of the balance sheet, and SVB was $2 billion short on the the third that really counts. Because this is capitalism.
Stay tuned to The Deep Dive for Banksplaining Part 2: Capital Reserves
Information for this briefing was found via Edgar, FDIC, MorningStar, and the sources mentioned or linked. The author has no securities or affiliations related to this organization. Not a recommendation to buy or sell. Always do additional research and consult a professional before purchasing a security. The author holds no licenses.