
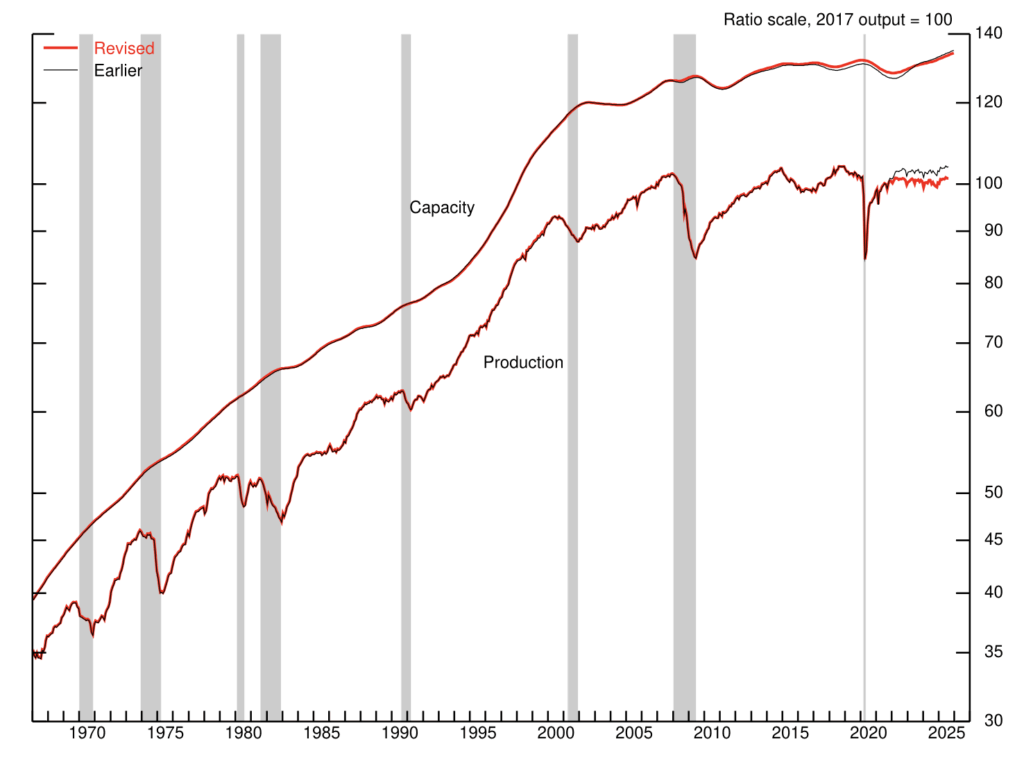
The Federal Reserve has “revised its indexes of industrial production, capacity, and utilization using benchmark data,” effectively erasing five years of reported industrial outperformance, leaving total US industrial production in August 2025 roughly flat versus February 2020 instead of the previously reported 2.2% gain.
Over the same period, manufacturing output now shows a net 1½% decline rather than a 1½% increase, while manufacturing capacity and utilization are revised meaningfully lower across 2021–2025.
The biggest hit lands on 2022, where the annual rate of change in total IP is revised down by 1.7% and manufacturing growth is reprofiled from an expansion year into a contraction year. Across 2020–2024, annual manufacturing growth rates are revised down by about ¾ percentage point on average, turning what had looked like a solid post-pandemic rebound into a weaker 2021 recovery followed by a persistent decline averaging roughly 1¼% per year from 2022 through 2024.
At the level of the overall industrial index, the Fed now estimates IP was essentially unchanged between February 2020 and August 2025, versus a previously reported 2.2% climb over that window. The revised annual pattern shows a 2020 drop, a 2021 rebound, and then weaker-than-reported momentum, including a downward 0.7-point revision to 2024 growth and only a minimal 0.1-point upward tweak to 2023. 
Within manufacturing, the revision is broad-based but particularly acute in nondurable goods. Annual rates of change for nondurables are revised down by about ¾ percentage point on average from 2020 to 2024, with a 3½-point downward revision in 2022 driven largely by chemicals and plastics and rubber products.
Durable goods follow a similar contour to previous estimates but still see average annual growth revised down by around ¾ percentage point over 2020–2024, while logging and publishing remain in structural decline with an additional ¼-point average downward adjustment in annual change.
By market group, the consumer goods index is now estimated to have risen in 2020 and 2021 before falling each year from 2022 through 2024, with net downward revisions concentrated in 2021 and especially 2022. Durable consumer goods growth is nudged down about ¼% point per year on average over 2020–2024, with the heaviest hits in 2023, while nondurable consumer goods growth is cut more sharply, with average downward revisions of ¾% point and particularly steep reductions of about 1½ points in 2021 and 2½ points in 2022.
Business equipment takes one of the largest hits among market groups. The Fed now shows the index falling sharply in 2020, rebounding in 2021–2022, and then declining in 2023 and especially 2024, with annual growth revised down by about 1% point per year on average between 2020 and 2024 and a roughly 3¾-point downward revision in 2022 alone. Defense and space equipment is revised down even more aggressively, with annual growth lowered by about 2¼% points a year over the same period.
Construction and business supplies indexes are now both shown falling in 2020, rising in 2021, and then declining each year from 2022 to 2024. Their annual rates of change are revised down by about ½ point and 1 point per year respectively over 2020–2024, reinforcing the picture of a short-lived rebound followed by renewed weakness. Materials output still shows a post-2020 rise through 2024 but with modest downward revisions, especially for durable non-energy materials and energy materials.
On the capacity side, total industrial capacity is now estimated to have grown more slowly than previously thought from 2022 through 2025, with annual growth revised down by about ½% point per year on average and the largest downward revision, about 1 point, in 2023. Overall capacity is expected to rise 1½% in 2025. Post-2021, capacity growth now averages 1.1% per year instead of 1.5%, well below the 1.9% long-run average from 1972 to 2024.
Manufacturing capacity growth is now pegged at only about ½% per year on average from 2022 to 2025, versus a long-run 2% norm, with growth gradually picking up but still just over 1% in 2025. Those figures reflect downward revisions of roughly ½ point per year over 2022–2025, with cuts spread across both durables and nondurables.
Mining capacity still grows at about 1¼% annually over 2022–2024, above its long-run trend, before a modest ¼% decline in 2025, but even here growth is revised down by around ½ point per year on average, again with a larger downward move in 2023. Utilities are the exception: electric and gas capacity growth runs at a robust 3¼% average from 2022–2025 and is projected at 4½% in 2025, with only minor revisions.
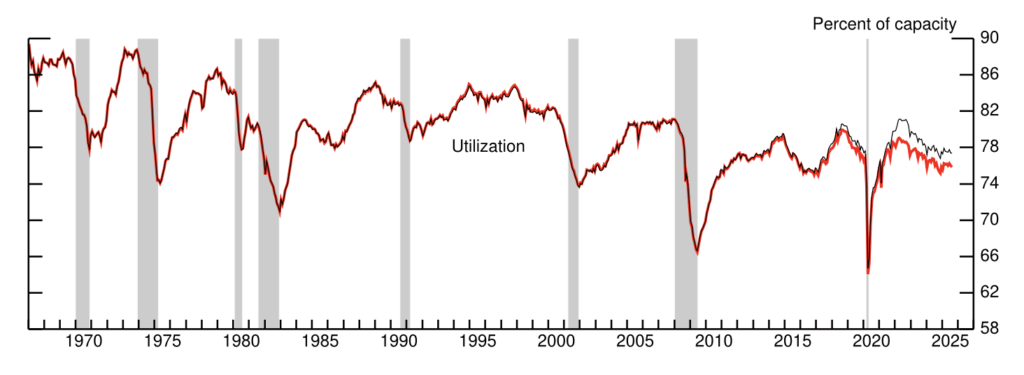
Utilization metrics are downgraded in line with weaker output and slower capacity growth. Total industry capacity utilization now falls to 74.5% in 2020, jumps to 78.3% in 2021, then drifts down to 75.5% by the fourth quarter of 2024, roughly 4 points below its long-run 79.5% average. On average, total utilization from 2021 through 2024 is revised down by about 1½ points, and the Fed now places August 2025 utilization at 75.8%. 
Manufacturing utilization peaks at 78.4% in 2021, roughly matching its long-run 78.2% average, before slipping to 74.8% in 2024. Across 2021–2024, factory utilization is revised down by about 1¼ points on average, with both durables and nondurables seeing similar-sized cuts and machinery, transportation equipment, and chemicals making the largest negative contributions. August 2025 manufacturing utilization is now estimated at 75.6%, 1¼ points below the earlier reading and about 2½ points below its long-run norm. 
Mining utilization now shows a jump to 81.5% in 2021 and a climb to 83.4% in 2024, still below its 85.2% long-run average, but these levels are revised down by about 6 points on average between 2021 and 2024, primarily due to lower operating rates in oil and gas extraction and mining support activities. Utilities utilization remains an outlier on the low side, at 72.2% in 2024, far below its 84.3% long-run average, though revised up by about 1 point versus the prior estimates.
Information for this story was found via the sources and companies mentioned. The author has no securities or affiliations related to the organizations discussed. Not a recommendation to buy or sell. Always do additional research and consult a professional before purchasing a security. The author holds no licenses.